Litecoin Looks Weak; Is LTC Retest Its Key Levels?

Litecoin was at its high on November 10, after which it declined and reached its low of $102. The coin started to uplift at the beginning of February but couldn’t cross the high of $143 and returned back to its lows. In a period of 3 months, the coin has reduced 199% and has been hugely profitable for the bears. In an intraday session on February 11, there was a price movement of 11% in favor of bears. The price is moving at the edges of the downtrend line, and once it closes below the support zone, a bearish momentum can be expected. LTC is moving in the sideways channel in between the price range of $168 and $102. Once the price closes above the swing high of $114, the coin may reach its resistance of $168.
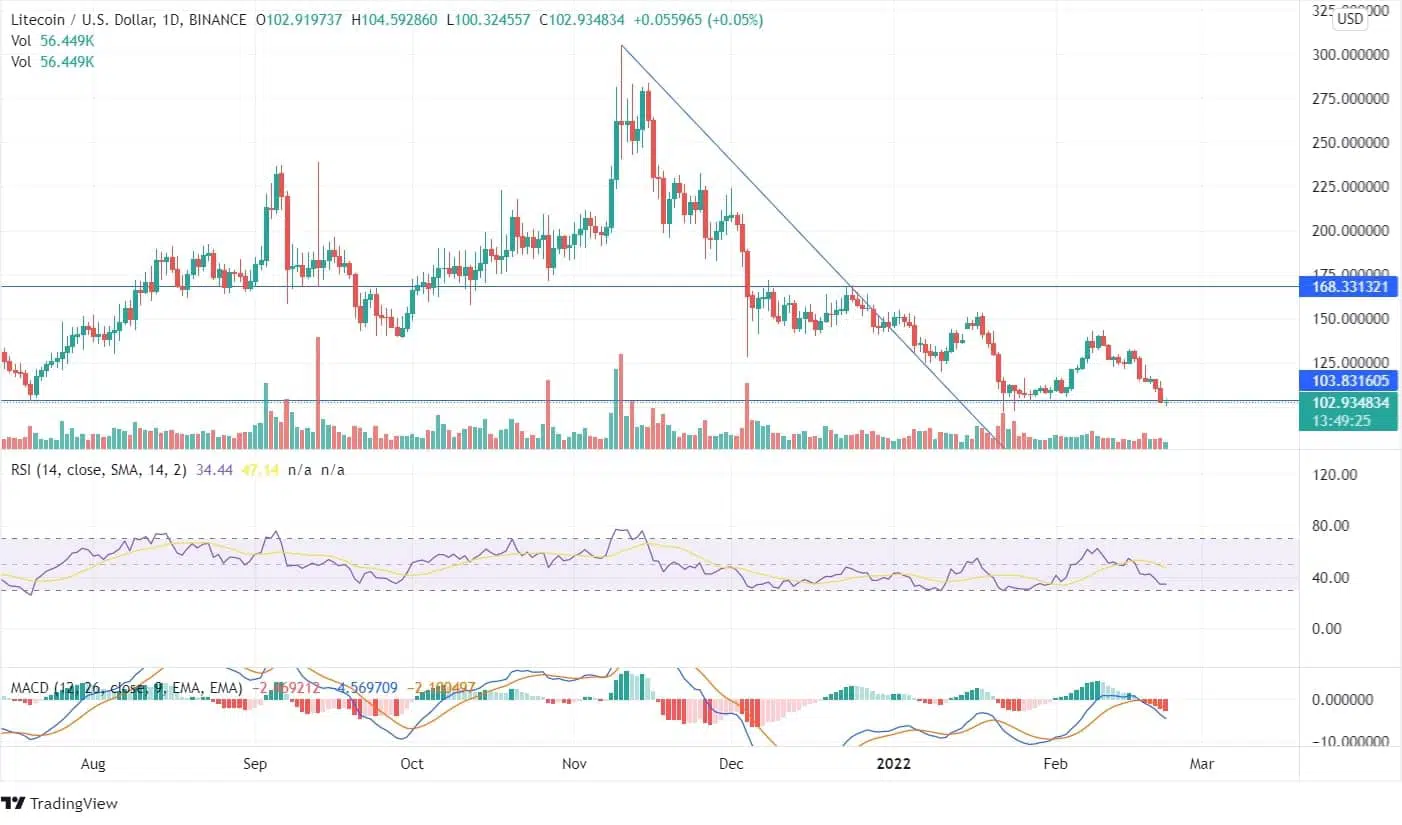
On the above chart, the MACD line trades below the signal line, indicating a bearish move. The RSI is 33 may head towards the oversold zone. On February 18, the volume bar favored bears, and a shooting star candlestick was formed, after which the coin price declined 11.7%.
On the weekly time frame, the indicators have been in the bearish zone since December, and Litecoin is trailing at the support zone. Based on the LTC price prediction, an upliftment in the price can be expected once the price closes above the support zone. However, if the coin closes below $97, it may reach its lower lows, and a bearish momentum may be followed in the long run. In the previous week, the bearish candle returned 22%.
If the bulls push the price up, the coin may reach its resistance of $168; however, if the coin continues to fall, it may reach its lows of $70. A turnaround in the coin may happen if the bullish candles continue to form with the supporting volume, and it may be an opportunity for the bulls.