Bitcoin Price Risks Deeper Pullback to $105k Amid Wedge Pattern Breakdown

- The Bitcoin price teases a bearish breakdown from the support trendline of a rising wedge pattern.
- Data from CryptoQuant shows a major transfer of 31,968 BTC (worth over $3.78 billion) from long-term holders, sparking a risk of potential sell-side pressure.
- The macroeconomics data accentuate inflationary pressure on the U.S. market, reducing the possibility of an interest rate cut in September.
- Bitcoin’s fear and greed index at 60% reflects that the broader market sentiment is still bullish.
The pioneer cryptocurrency, Bitcoin, takes another dive of 1.15% during the U.S. market hours to trade at the $116,142 mark. The increasing selling pressure can be attributed to dampened investor sentiment regarding the decreasing likelihood of a September interest rate cut. The bearish momentum has further accelerated with the recent movement of dormant Bitcoin, increasing the risk of a potential sell-off. The falling coin price also breached the support trendline of a key reversal pattern. Will the BTC price break below $110?
Bitcoin Price Drops as Dormant $3.78B BTC Moves On-Chain
In the last five days, the Bitcoin price showed a notable pullback from $124,500 to the current trading value of $116,225, projecting a 6.62% loss. A major portion of this pullback came last Thursday as hotter-than-expected U.S. July PPI data had dampened investors’ optimism for a potential interest rate cut in September.
The selling pressure also gained momentum as a substantial amount of dormant BTC was moved. In a recent post from CryptoQuant analyst Maartunn highlighted that approximately 31,968 BTC (worth over $3.78 billion) aged between three and five years were suddenly moved on-chain.
Data from past cycles show such a spike has often coincided with pivotal market movement.
- 24 Jan 2024—33,803 BTC transfer aligned with market bottom.
- 23 Mar 2024—95,090 BTC movement was followed by a local top.
- 22 Jun 2024—43,641 BTC exited dormancy, adding extra selling pressure in a drawdown.
- 30 Jul 2024—29,994 BTC transfer coincided with a local top.
- 24 Dec 2024—23,012 BTC moved; also came across a local top.
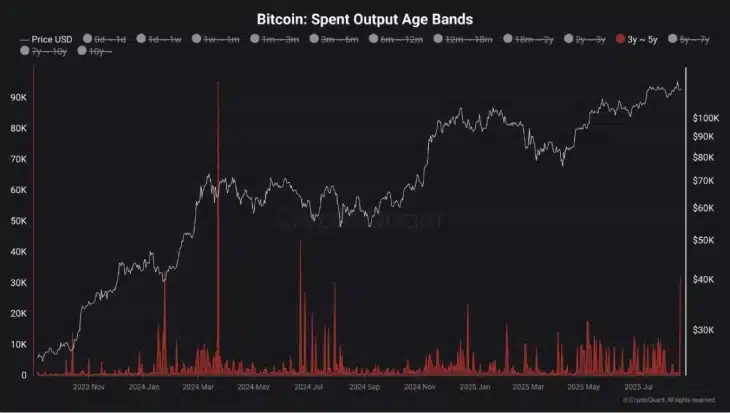
Typically, the long-term holders are considered “smart money,” who often accumulate in bear phases or at a discounted price and distribute them at a high price in bull runs. If the aforementioned 31,968 BTC are moved to exchanges, a risk of potential selling could bolster the current market pullback.
Also Read: Will Ethereum Price Recovery Surpass the $5,000 Barrier?
Bitcoin Price Faces Prolonged Pullback Amid Wedge Pattern Breakdown
With the intraday sell-off, the Bitcoin price teases a bearish breakdown from the support trendline of a rising wedge pattern. Since March 2025, the coin price has been actively resonating between the two converging trendlines of this reversal pattern, driving a sustained recovery.
So far, the coin price has bounced thrice from the upper trendlines and the same with the lower trendline, validating the pattern’s credibility to influence price movement. Historically, a bearish breakdown below the pattern support trendline has triggered a major correction in financial assets.
The momentum indicator RSI dropping below the 50% mark also reflects a shift in market sentiment towards a bearish outlook. If the daily candle closes below the bottom trendline, the sellers could hold the breached level as potential resistance to extend the current correction.
The post-breakdown fall could push the Bitcoin price below the $112,000 support and hit the $105,280 floor, accounting for a potential 9.5% loss.
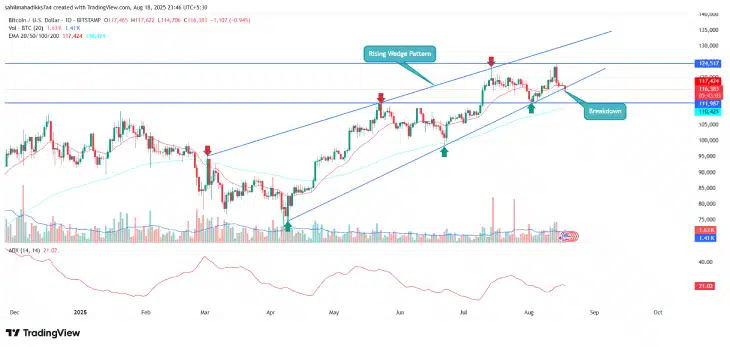
BTC/USDT- 1d Chart
On the contrary note, if the sellers failed to sustain this breakdown, it could push the price back within the channel pattern.
Also Read: Solana Price Faces 12% Fall as SEC Delays Decision on Bitwise Spot SOL ETF