
Key Highlights:
- The Litecoin network has seen a surge in user activity and adoption, with over one million new funded addresses added in the past 18 months.
- A bull-flag pattern drives the current correction trend in LTC.
- The buyers seek pullback support from the fast-moving exponential moving average of 20.
- The formation of the symmetrical triangle pattern drives the mid-term sideways trend in price.
On Thursday, July 18th, the decentralized peer-to-peer cryptocurrency Litecoin slid 2.3% to reach $107.7. The selling pressure aligns with the broader market pullback, signaling the continued prevailing correction. However, the recent on-chain data shows a steady growth in the number of LTC addresses with balances, indicating an increase in the user base and adoption. Will the fundamental support the Litecoin price for a $120 breakout?
LTC Adoption Surges as One Million New Funded Addresses Added
Over the past six weeks, the Litecoin price showcased a parabolic rally from $76 to a recent high of $122.29, registering a 60% growth. A primary catalyst behind this rally was the regulatory development in the United States, but the LTC price gained additional momentum from the increasing number of addresses on its networks.
According to analytics platform Sentora, over one million new funded addresses have entered the Litecoin network in the past 18 months. This milestone reflects a growing base of retail and institutional engagement with LTC as a long-term store of value.
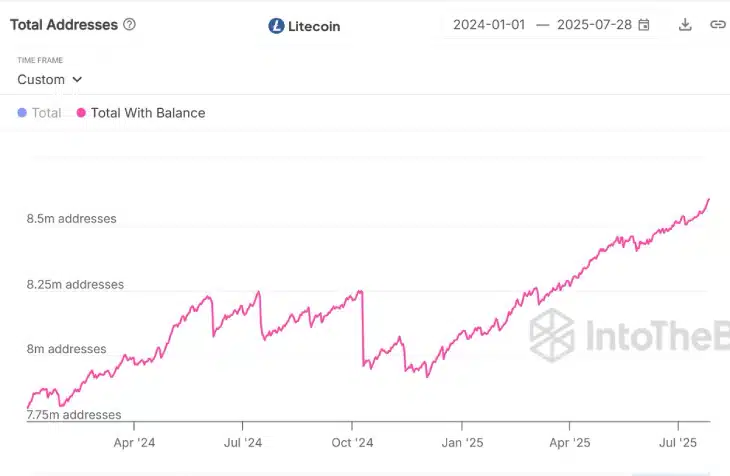
Total Addreses | Sentora
If the trend continues, the coin price could witness organic growth and drive a steady uptrend in the long term.
Flag Pattern Hints Potential Breakout From Price Correction
Over a week, the Litecoin price showcased a brief correction from a $122.3 high to the current trading price of $108.23, registering an 11.5% loss. Interestingly, the pullback resonated strictly within two downsloping trends, which reveals the formation of a bullish continuation pattern called ‘Flag.’
The chart setup is characterized by a steep ascending trendline as a pole, denoting the dominant trend in the market, followed by a short pullback to recuperate the bullish momentum.
According to Coingecko data, the asset shows a market cap of $8.16 billion and a 24-hour trading volume of $676.15 million. With today’s price drop, the coin signals a bear cycle within the flag channel, which could lead to a 3.5% drop to test the bottom trendline at $104.3.
The momentum indicator RSI below 50% accentuates a bearish sentiment shift in the short-term trend. Until the coin price consolidation within this structure, the current consolidation could prolong to deeper levels.
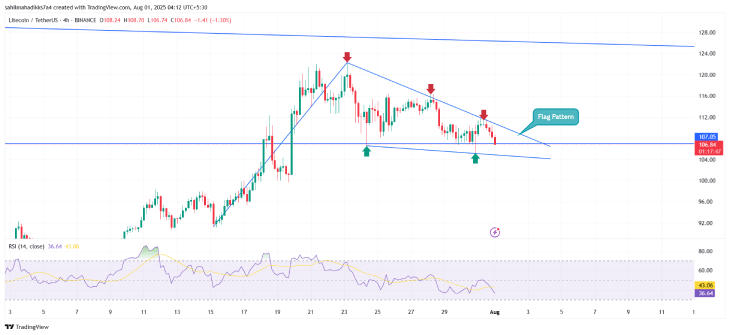
LTC/USDT -4hr Chart
Thus, a potential breakout from the pattern’s resistance trendline will intensify the buying pressure and drive a potential 15% surge to hit $126.
Triangle Pattern Drives Sideways Trend in Litecoin Price
The daily chart analysis reveals the coin price has been resonating within two converging trendlines over the past 8 months, indicating the formation of a symmetrical triangle pattern.
The altcoin bounced at least twice from both these trendlines, validating its credibility to influence the price trajectory.
If the aforementioned Flag breakout materializes, the LTC press could retest the upper boundary of a triangle structure. Historical data shows a retest of the pattern’s resistance trendline accelerated the market selling pressure and drove a price correction of 41% to 51%.
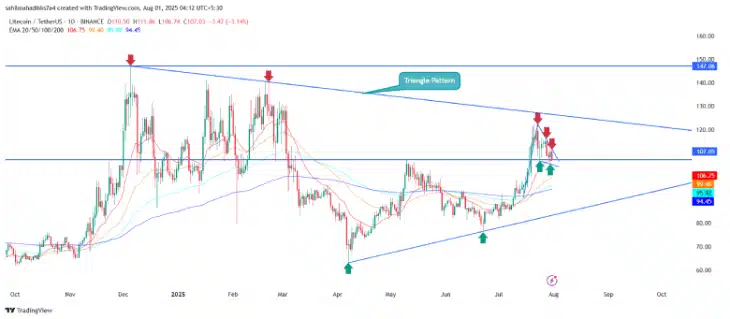
LTC/USDT -1d Chart
On the contrary, the LTC price is still positioned above the crucial daily EMAs (20, 50, 100, and 200), indicating the broader market sentiment is bullish. Thus, a potential breakup from the pattern’s resistance trendline will signal a major change in market dynamics and set the price for a $150 breakout.
Also Read: Cardano Witnessing an Increase in Purchases From Institutional Players and Whales